Gap Analysis
While a gap analysis can be either concrete or conceptual, gap analysis templates often have in common the following fundamental components:
Current state: A gap analysis template starts off with a column that might be labeled “Current State,” which lists the processes and characteristics an organization seeks to improve, using factual and specific terms. Areas of focus can be broad, targeting the entire business; the focus instead may be narrow, concentrating on a specific business process, depending on the company’s outlined target objectives. The analysis of these focus areas can be either quantitative, such as looking at the number of customer calls answered within a certain time period; or qualitative, such as examining the state of diversity in the workplace.
Future state: The gap analysis report should also include a column labeled “Future State,” which outlines the target condition the company wants to achieve. Like the current state, this section can be drafted in concrete, quantifiable terms, such as aiming to increase the number of fielded customer calls by a certain percentage within a specific time period; or in general terms, such as working toward a more inclusive office culture.
Gap description: This column should first identify whether a gap exists between a company’s current and future state. If so, the gap description should then outline what constitutes the gap and the factors that contribute to it. This column lists those reasons in objective, clear and specific terms. Like the state descriptions, these components can either be quantifiable, such as a lack of workplace diversity programs; or qualitative, such as the difference between the number of currently fielded calls and the target number of fielded calls.
Bridging the gap
Next steps and proposals: This final column of a gap analysis report should list all the possible solutions that can be implemented to fill the gap between the current and future states. These objectives must be specific, directly speak to the factors listed in the gap description above, and be put in active and compelling terms. Some examples of next steps include hiring a certain number of additional employees to field customer calls; instituting a call volume reporting system to guarantee that there are enough employees to field calls; and launching specific office diversity programs and resources.
Gap analysis tools and examples
There are a variety of gap analysis tools on the market, and the particular tool a company uses depends on its specific set of target objectives. The following are some common gap analysis methods:
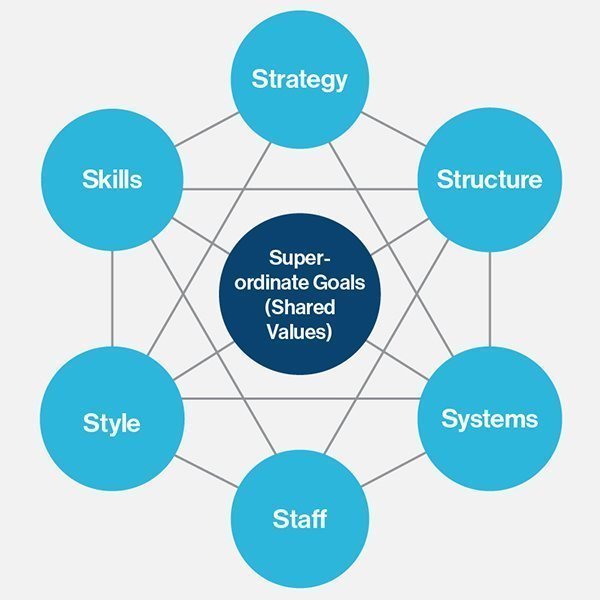
McKinsey 7S Framework: This gap analysis tool, named after consulting firm McKinsey & Co., is used to determine specific aspects of a company that are meeting expectations. An analyst using the 7S model examines the characteristics of business through the lens of seven people-centric groupings: strategy, structure, systems, staff, style, skills and shared values. The analyst fills in the current and future state for each category, which would then highlight where the gaps exist. The company can then implement a targeted solution to bridge that gap.
SWOT analysis: SWOT, which stands for strengths, weaknesses, opportunities and threats, is a gap analysis strategy used to identify the internal and external factors that affect the effectiveness and success of a product, project or person. Once these factors are determined, the company can then determine the best solution by playing to their strengths, allocating resources accordingly, while at the same time avoiding potential threats.
Nadler-Tushman model: The Nadler-Tushman organizational congruence model, named after Columbia University professors David A. Nadler and Michael L. Tushman, examines how business processes work together and how gaps affect the operational efficiency of the organization as a whole. The model analyzes these operational gaps by analyzing the company’s operational system as one that transforms inputs into outputs, dividing the business processes into three groups: input, transformation and output. Input includes the operational environment, tangible and intangible resources used, and the company culture. Transformation encompasses the existing systems, people and project activities currently in place that convert input into output. Outputs can take place at a system, group or individual level. The Nadler-Tushman model puts a spotlight on how inadequate inputs and transformation functions that fail to work together cohesively can lead to gaps, as well as how gaps in the outputs can point to problems in the inputs and transformation functions. This model highlights how the various components fit together, or are congruent — the more congruent these parts are, the better a company performs. The Nadler-Tushman model is a dynamic one that changes over time.